Results of optimised nZEB parametric models

Already today buildings can be realised in the nearly zero and plus energy standard. These buildings achieve extremely low energy demands and low CO2 emissions and can be operated economically. For this reason, the motivation in the CRAVEzero project is not only based on the energy characteristics of buildings, but also on their life cycle costs. However, the broad market deployment of these buildings is progressing very slowly so far, as methods and processes for the cost-optimal integration of efficiency measures and renewable energies are not yet sufficiently described and therefore not yet familiar. As a consequence – many poorly planned buildings are criticised for the fact that the actual energy consumption of highly efficient buildings is higher than the predicted demand and that high-efficiency standards are expensive and uneconomical. The influence of the user behaviour of such energy-efficient buildings is another aspect, which has to be considered to evaluate the impact on the energy consumption of the building.

The identification of suitable methods for the energetic-economic optimization of highly efficient buildings in all life cycle phases is a prerequisite for the broad market implementation.
This method was developed earlier in the CRAVEzero project and documented in Deliverable D6.1 “Parametric models for buildings and building clusters: Building features and boundaries”.
In this Deliverable D6.2, the method was applied to the five CRAVEzero case studies Aspern IQ, Alizari, Isola Nel Verde, Les Heliades and MORE to perform parametric calculations and to perform multi-objective energy and cost analysis over the life cycle of the buildings.

In total, more than 230,000 variants were calculated and analysed, with the key performance indicators: financing costs, net present value, balanced primary energy demand and balanced CO2 emission. The calculation results can be found in this report as well as on the CRAVEzero pinboard: http://www.cravezero.eu/pinboard/Dashboard/DBInfo.htm
Furthermore, the goal of this Deliverable was the extension of the sensitivity analysis to all available CRAVEzero case studies, on the one hand aiming at identifying which input parameters affect the LCC the most and on the other hand aiming at providing this output as a range of values and not as a punctual one. In this way, the implications of uncertainty issues related to the assumptions on input parameters and boundary conditions can be highlighted.
The
third part of this Deliverable deals with the investigation of a renovation
project and describes the steps from the energy audit to the implementation of
energy efficiency improvements.
The following points show an extract from the results and findings:

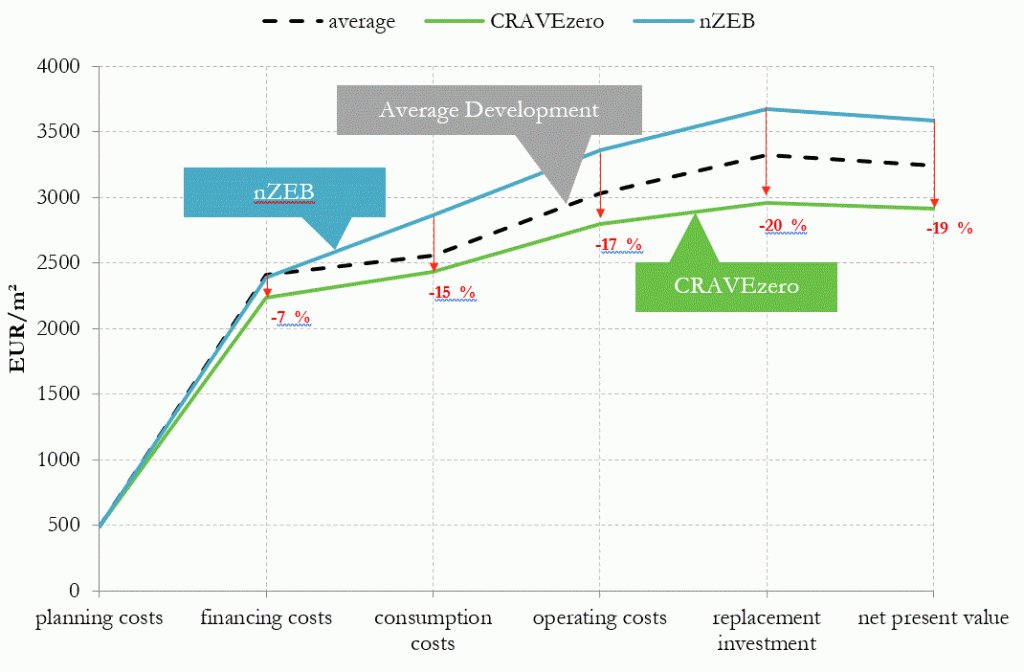
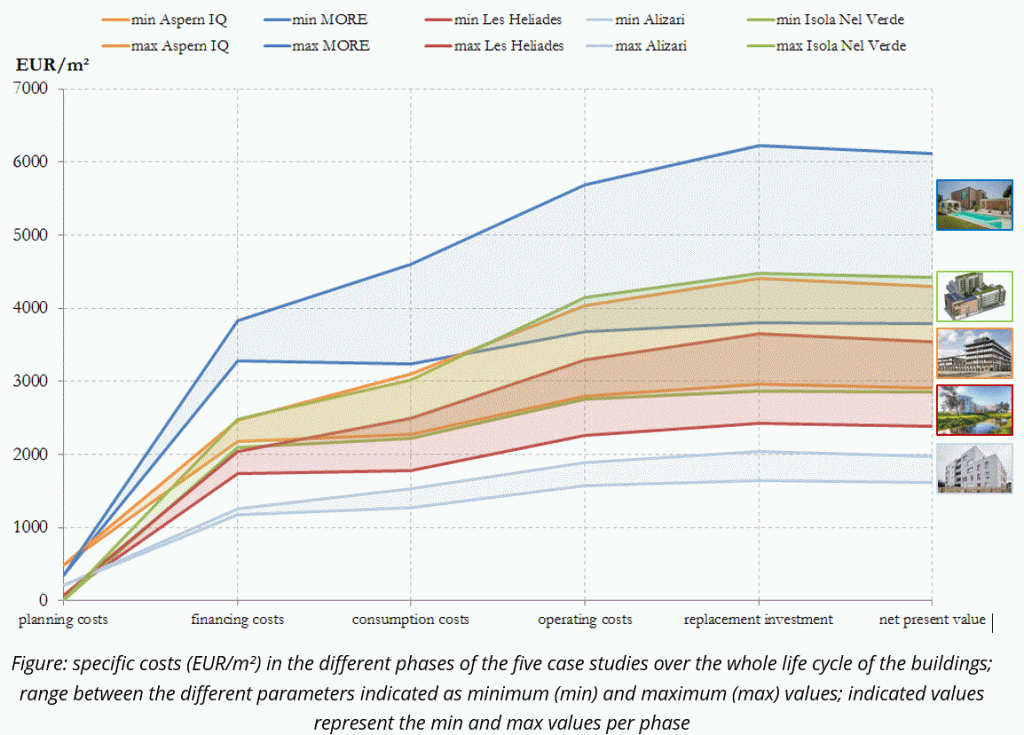
- Even if the financing costs are very different from case study to case study (range between 1,200 EUR/m² and about 3,500 EUR/m²), the divergence between the highest and lowest financing costs within the individual case studies is nearly the same in all case studies. It´s between 7 % and 16 %.
- The same statement also applies to the results of the net present value calculations. The net present values range between 1,500 EUR/m² as the lowest value and more than 5,600 EUR/m² as the highest value. But within the different case studies, the divergence between the highest and the lowest net present value is about 13 % to 26 %.
- Compared to the costs, the range between the highest and the lowest balanced primary energy demand as well as between the highest and the lowest balanced CO2 emissions is much higher. For these key performance indicators, possible reductions between 30 % and 85 % are realistic.
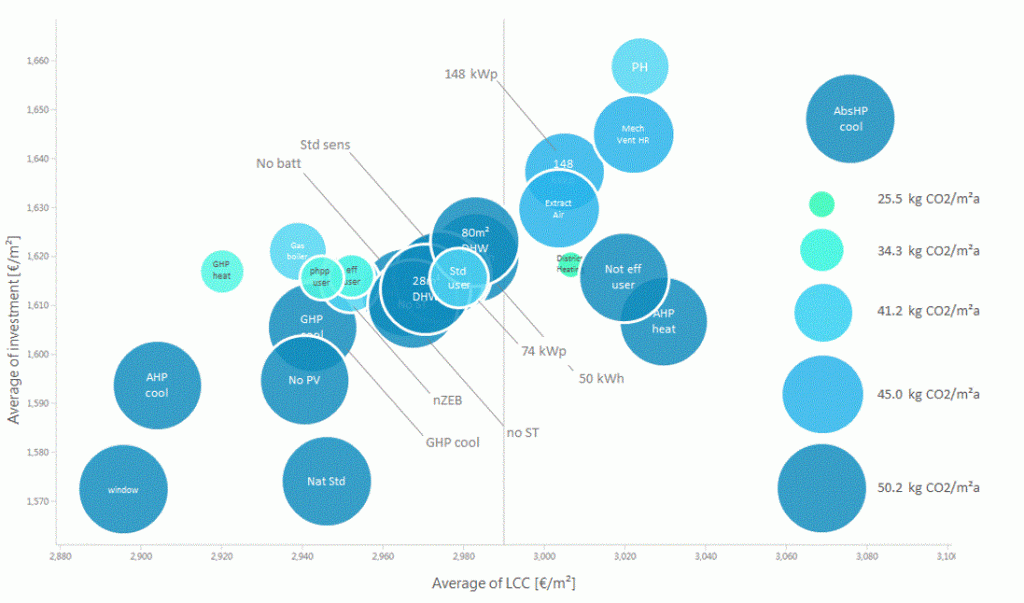
- The detailed analysis of the result shows that the most influencing factors (varied parameters) are the heating system, the ventilation system (especially influencing the financing costs and the net present value) as well as the user behaviour (influencing primary energy demand and CO2 emissions).

