
nZEB related co-benefits
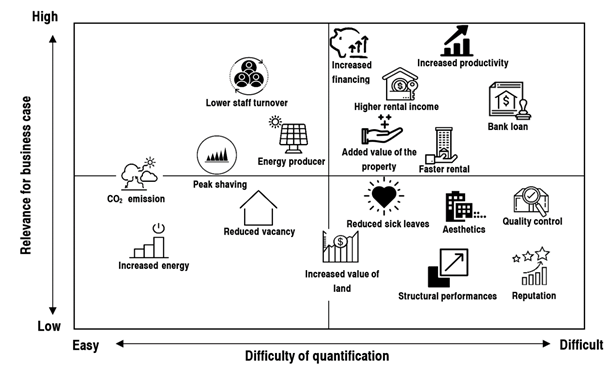
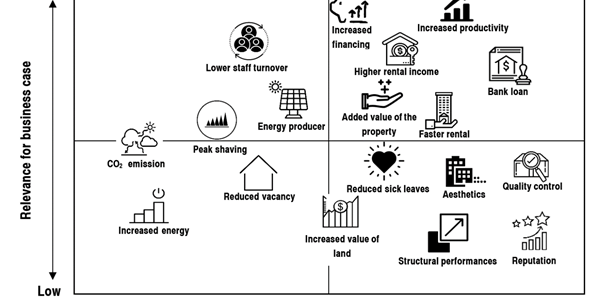
Figure 66: Co-benefits structured in terms of relevance for the business case and difficulty of quantification
The pinboard tool for the co-benefit analysis can be found here: https://www.cravezero.eu/pboard/Developer/RevenueInfo.htm
Specific additional incentives for nZEBs, so-called “co-benefits”, are often forgotten. Co-benefits are the added benefits that can be achieved, above and beyond the direct benefits of energy savings, climate protection and lower operational costs. They are also referred to as “multiple benefits” or “synergies”. These relate primarily to the occupants who are in the buildings every day. Especially for nZEB office buildings, it is important to understand that the following co-benefits can also have a financial impact. To show the relevance of these co-benefits, the following (Figure 66) shows how the individual co-benefits are structured in terms of relevance for business cases and difficulty of quantification.
- Health benefits
- Increased productivity
- Lower staff turnover
- Reduced sick leaves
- Employment creation
- Market potential
- Owner as energy producer
- Added value for a nZEB property
- Integration of RES
- CO2 emission savings
- Increased energy security
- Aesthetics and architectural integration
- Increased value of land/context
- Increased reputation and good publicity
- Press clipping increase
- Reduced vacancy due to nZEB
- Faster rental of the building
- Higher rental income
- Increased financing by lower interest rate
- Increased financing from bank loan
- Prefabricated building – quality control
- Prefabrication – cost and time efficiency and control
- Prefabricated building – on-site work
- Prefabricated building – façade integration
The advantages of these co-benefits can be very complex. This is due in particular to the fact that research is still in the early stages of these aspects. Therefore, it is often difficult to find statistically founded robust values that allow individual co-benefits to be quantified. However, some studies can serve as a basis for such quantifications. Recent papers that deal with employee turnover and employee satisfaction (Miller et al. 2009), productivity (Hedge, Miller, and Dorsey 2014), (Thatcher and Milner 2014) and employee absenteeism (Singh et al. 2010) already provide estimations for the implementation of co-benefit evaluation.
Studies show that employees in nearly zero energy buildings perceive a positive effect of their working environment and productivity (Thatcher, 2014), (Singh, 2010). In one case, a 10,000 m2 office building, an increase in productivity of 0.3 % was reported, equivalent to 8 €/m2a.
A study has noted a decline in absenteeism in nearly zero energy buildings (Thatcher, 2014).
An American study showed that around 20-25 % of 534 companies reported higher employee morale, easier recruitment of staff and more effective customer meetings (Miller, 2009). Also, 19 % reported lower employee turnover.
In addition to well-being and productivity, higher revenues from rent or sales may be expected. (Bleyl., 2017) reviewed previous studies and concluded that higher rent income might range roughly between 5 % and 20 %. Furthermore, higher market valuations may range from below 10 % to up to 30 %.
It should be noted, concerning green buildings, productivity and wellbeing, that a recent study pointed out, that social factors may have a more significant impact, in monetary terms, than environmental factors (Hugh, 2016).
The value of positive news articles about a specific building or a specific project could also be comparable to advertising costs in the specific source, in which the article is published (Berggren, 2017).
In order to obtain a targeted overview of the users’ understanding of co-benefits, a survey was launched as part of the EU Horizon 2020 project CoNZEBs (2017-2019). The focus was placed on indoor air quality, comfort, building location and low energy costs (Zavrl. 2019).
Depending on the perspective of the stakeholders, the interests, target criteria, and co-benefits can vary significantly. Figure 19 shows the criteria and co-benefits according to the interests of the different stakeholders. To achieve low heating costs, for example, the tenant is not only interested in low rental costs but also low operating costs and therefore a good energy standard. As a general rule, the building contractor aims to keep his construction costs low. For properties used by the owner, both cost components are essential, the initial investment and the operating costs. For public owners and users, the total life cycle costs and also the effects such as CO2 emissions are of interest.
Figure 67: Stakeholder related benefits and co-benefits of nZEBs
To assess the direct monetary value of a building, there are various co-benefits for the individual stakeholders, which often cannot be assessed directly in monetary terms and therefore do not appear in the life cycle cost analysis. These concerns marketability, rentability, value development, comfort, but also image, climate protection or regional goals such as energy autonomy. As far as possible, these advantages and additional benefits should be taken into account by the various stakeholders in the relevant decision-making process. These additional criteria can often overlap with the main criteria. An example is the use of an air-source heat pump in a very noise-sensitive environment. The air-source heat pump may perform relatively well in terms of energy and costs, including life cycle costs, but can cause problems due to increased noise pollution on the property and adjacent land. For this reason, it is crucial to quantify the added value of nZEBs in monetary terms by communicating and presenting business opportunities in such a way that potential investors understand and weigh up the pros and cons of an investment (Bleyl, 2016).
Methodology
In two CRAVEzero case studies, various co-benefits such as increased productivity, improved health, advertising value e.g. are examined to show the effects of individual co-benefits on payback time in particular.
Cost-benefit analysis of nZEBs for project developers
Using the calculation bases of (Berggren, Wall, & Togerö, 2017), effects of various co-benefits on the life cycle costs of nZEB were quantified. The following formula explains the procedure of these calculations.
The value of reduced energy consumption and exported energy described in the first formula summarizes the reduced energy costs (REC). For this purpose, the profitability of the increased costs associated with increased energy efficiency and the environmental values of the building were evaluated. In addition, investment costs were compared with energy efficiency and other sustainable values. Maintenance and renewal costs are not included in this formula.
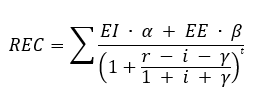
Where: EI is reduced imported energy, EE is increased exported energy, α is energy tariff of EI, β is energy tariff of EE, r is the nominal discount rate, i is the inflation rate and γ is increased in energy tariffs
Based on this calculation of (Berggren, Wall, & Togerö, 2017), a sensitivity analysis was carried out to show the effects that different co-benefits can have on the payback time of an nZEB.
Case Studies
The industry partners of the CRAVEzero consortium provided information on 12 existing reference buildings, considered as representative of the current best practices in the construction of new nZEBs with different functions and contexts. The industry partners participated in the design and/or the construction or operational phase of the buildings, and thus have access to detailed relevant data. These case studies include both residential, and office buildings and are located in the CRAVEzero countries: Austria, France, Germany, Italy and Sweden. Two of these case studies were used for the co-benefit analyses.
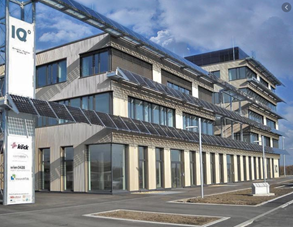
Figure 68: Aspern IQ
General information
- Owner: City of Vienna
- Architect: ATP Wien
- Energy concept: Renewable power, environmental heat, and waste heat
- Location: Vienna (Austria)
- Year of construction: 2012
- Net floor area: 8817 m2
Key technologies
- Groundwater heat pump
- Photovoltaics
Aspern IQ is located in Vienna’s newly developed urban lakeside area “Aspern” - Austria’s largest urban development project and also one of the largest in Europe. The building was designed in line with Plus Energy standards and is conceived as a flagship project which showcases the approach to creating a plus energy building which is adapted to locally available materials and offers the highest possible level of user comfort while meeting the demands of sustainability.
In the Aspern IQ reference building, to be able to filter out the influences of the individual co-benefits, the economic and energetic building data were used in order to be able to map the influences as accurately as possible. A parametric cost-benefit analysis with changing individual parameters of the co-benefits was performed to see how the added values affect the project. For this purpose, the data shown in Table 14 below were determined. The assumed property value was determined using a comparative value method with comparable buildings in Austria.
Table 16: Data of the reference building
| Financial | |||
| Residential/non residential | Non-residential | ||
| Saleable / rentable area | 6,600.00 | m² | |
| Expected sales year of property | 30 | years | |
| Assumed property value | 3,914.00 | €/m² | |
| Rents to tenants | 144.00 | €/m²a | |
| Expected yield | 10 | % | |
| Rental or owner-occupation | Rental | ||
| Estimated vacancy rates | 6 | % | |
| Number of employees | 250.00 | employees | |
| Energy | |||
| Treated floor area | 6,633.00 | m² | |
| Heating demand | 50.00 | kWh/m²a | |
| Cooling demand | 10.00 | kWh/m²a | |
| Electricity demand | 40.00 | kWh/m²a |
Furthermore, with regard to the fact that this is a nearly zero energy building, there are additional aspects concerning the economy which cannot be ignored under any circumstances. This concerns particularly the additional costs and the energy targets of the construction of a nearly zero energy building.
Table 17: Aspects which are based on high quality nearly zero energy buildings
| Financial | |||
| Additional nZEB costs | 171.60 | €/m² | |
| Energy | |||
| Heating demand | 21.00 | kWh/m²a | |
| Cooling demand | 2.00 | kWh/m²a | |
| Electricity demand | 18.00 | kWh/m²a | |
| PV yield | 14.55 | kWh/m²a | |
| PV yield: self-consumption | 10.00 | kWh/m²a |
Based on this building data, the different co-benefits were considered in Aspern IQ. Calculation results with and without the consideration of co-benefits clearly show the influence of the individual parameters on the overall cost curve over 30 years and especially the breakeven of the additional nZEB investments as can be seen in Figure 69. The following list shows the applied co-benefits.
• Yield reduction due to high quality nZEB
• Reduced vacancy
• Higher rent
• Faster rental of the building
• Reduced maintenance costs
• Number of press clippings
• Increased productivity
• Lower staff turnover
• Reduced sick leaves
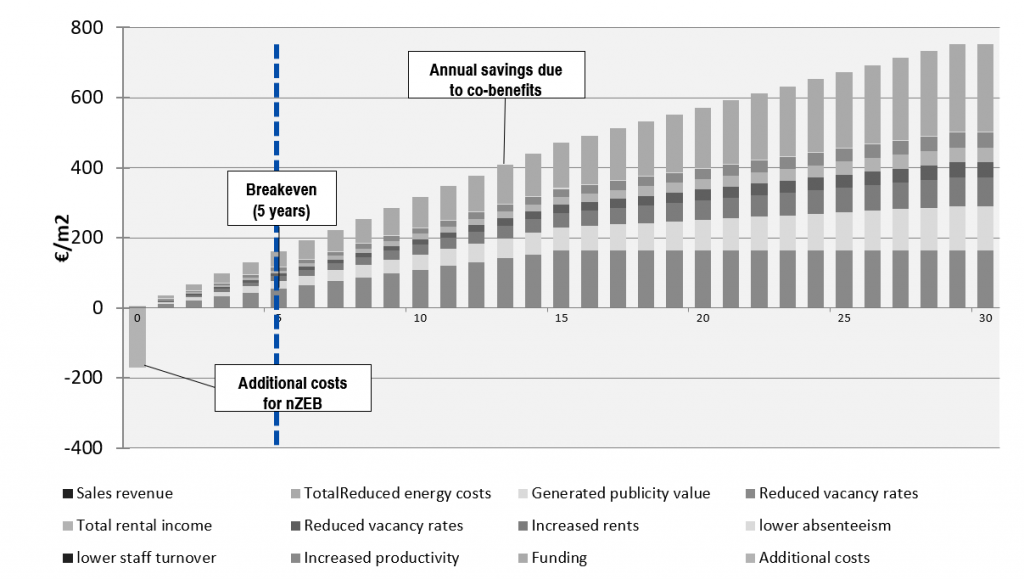
Figure 69: Payback time and breakeven point under consideration of co-benefits over a time period of 30 years
Results
SA has been performed first, applying the DSA method and then the EE method. For each one of these methods, the two approaches for the baseline values, previously illustrated, are displayed. Moreover, the discount rate has been inserted as a variable parameter to add the effect of its variation to the SA. In DSA the effects, the sensitivity index for 3 scenarios was calculated: discount rate 1, 2 and 3 %. In the EE method, the discount rate was added to the investigated parameters.
In the first approach, where real values for the baselines are adopted, the three most influencing co-benefits are “higher rent”, “yield reduction due to a high quality nZEB” and “reduced vacancy”. However, quite different outcomes are obtained if the second approach is considered: the most influencing values by far are “yield reduction due to hq nZEB” and “increased productivity”.
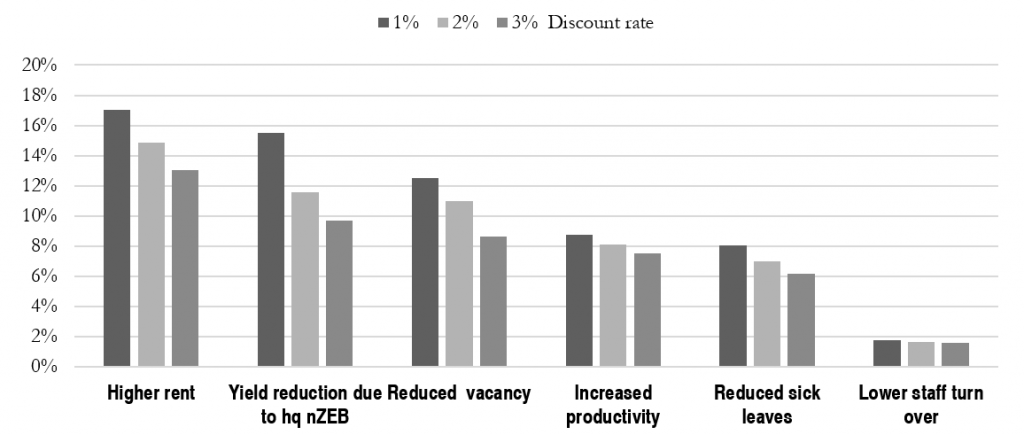
Figure 70: Sensitivity index related to real values baseline – discount rate 1, 2 and 3%
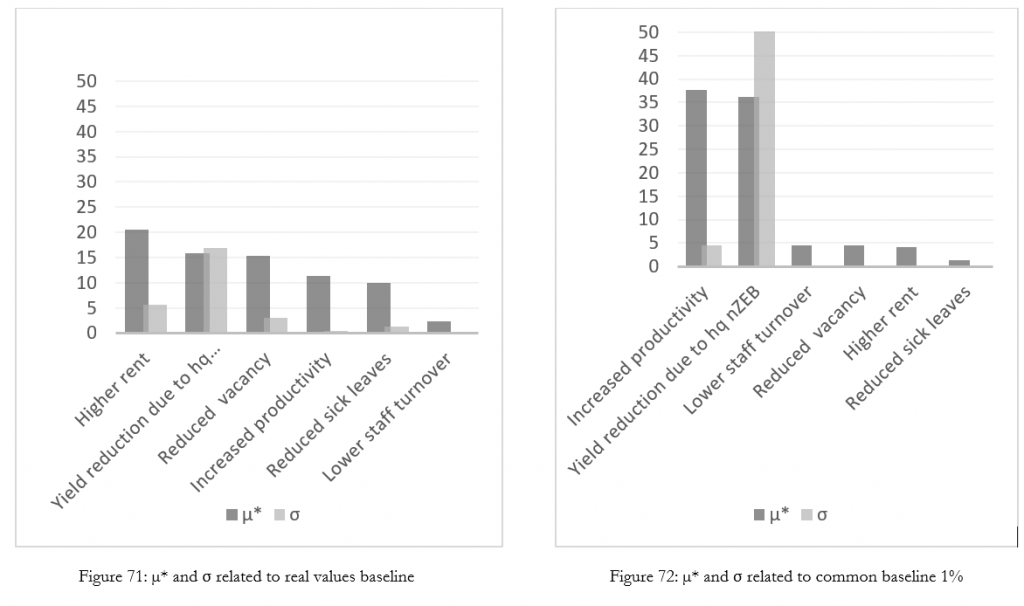
In (Berggren et al., 2018), increased productivity is indicated as the co-benefit with the largest relative impact. This statement is confirmed by results obtained with the second approach, which applies a fixed variation of 1 % equal to all co-benefits. A productivity increase of 1 % corresponds to 22 €/(m2a) of labor cost savings, assuming an average monthly salary per employee of 3,000 € and employer & social costs (excl. holiday allowance) equal to 60 %. Nevertheless, the questions that should be further investigated are “how much can actually the productivity increase vary?”, “Is it plausible a productivity increase of 1 %? And 2 %?”.
(Bleyl et al., 2017) state that in some cases a rent increase related to a green building can range from below 4 % up to 21 %. For this analysis a 5 % rent increase has been conservatively selected for the approach which takes into account baseline values from the literature. Nevertheless, in this case, this co-benefit showed the highest sensitivity index and µ*.
Väla Gård

Figure 73: Väla Gård
A prefabricated 120 mm concrete wall with 200 mm graphite EPS is used. Heat and hot tap water are produced using a geothermal heat pump, the geothermal solution can also be used for cooling. Demand controlled ventilation system is used to ensure air quality with sustained energy performance.
Based on the equations presented in section 6.3 Methodology, the following parameters were investigated:
- Reduced energy costs (due to decreased energy demand)
- Increased rental income (due to lower vacancy rate)
- Publicity value (based on number of press clippings)
- Increased productivity
- Lower staff turnover
- Lower sick leaves
To investigate the effect of the co-benefits listed above, a reference building is defined, towards which the case study, Väla Gård, is compared to. The reference building and boundary conditions are described in Table 18. Input data for the investigated parameters are described in Table 19.
Initially, each parameter is investigated followed by a combination of all parameters. A sensitivity analysis is included. The sensitivity analysis involves a variation of each parameter by ±25 % when all parameters are combined.
Table 18: Summary of reference building and boundary conditions
| Financial info – reference building | |
| Type of building | Non-residential |
| Saleable/rentable area | 1 600 m2 |
| Rent to tenants | 70 €/m2a |
| Vacancy rate | 15 % |
| Employees | 70 persons |
| Energy – reference building | |
| Treated floor area | 1 670 m2 |
| Heating energy (electricity) | 22 kWh/m2a |
| Cooling energy (electricity) | 5 kWh/m2a |
| Electricity, excluding heating and cooling | 65 kWh/m2a |
| Boundary conditions | |
| Nominal discount rate | 7 % |
| Inflation | 2 % |
| Tariff for imported energy | 0.12 €/kWh |
| Tariff for exported energy | 0.10 €/kWh |
| Annual energy tariff increase | 2 % |
| Average salary costs | 6 350 €/employee |
| Average employee turnover, Sweden (Statistics Sweden, 2020) | 4 % |
| Average sick leave | 6 days/year |
| Value for publicity | 3 500 €/article |
Table 19: Input data for investigated parameters
| Reduced energy costs | |
| Heating energy | 4 |
| Cooling energy | 1 |
| Electricity, excluding heating and cooling | 35 |
| Increased rental income | |
| Vacancy rate | 5 % |
| Publicity value | |
| Press clippings | 10 articles |
| Increased productivity | |
| Increased productivity | 0.5 % |
| Lower staff turnover | |
| Reduced employee turnover | 0.5 % |
| Lower sick leaves | |
| Reduced sickness absence | 10 % |
Results
In Figure 74, all co-benefits investigated above have been included. A base case (BC) is presented together with a worst-case and an optimal case. The base case is a case where all co-benefits above have been included together with the additional costs and the cost reductions received in the project. In the worst case, the additional costs have been increased by 25 % and the business benefits have been reduced by 25 %. In the optimal case, the changes are the opposite. I.e. additional costs have been reduced by 25 % and the business benefits have been reduced by 25 %. In the base case, the cumulative savings exceed the additional costs after roughly four years. In the optimal and worst case, the cumulative savings exceed the additional cost after roughly three and eight years respectively.
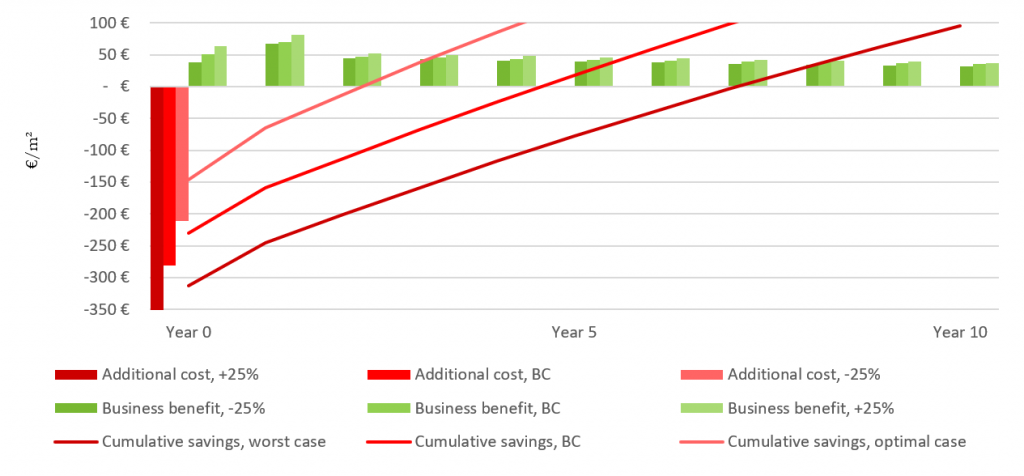
Figure 74: LCC-analysis for Väla Gård, including all benefits listed before
Conclusion
The co-benefits have been analyzed in particular with regard to their influence on the payback time and profit over a period of 30 years for the case studies Aspern IQ and Väla Gard. Increased productivity of the employees due to higher building quality and comfort and a possible higher rental income due to a better building standard are the most important factors with regard to the payback time and profit. But also the other co-benefits, which were examined here in more detail, have a significant influence.
Even influences which are usually not considered and harder to quantify, such as the productivity of the employees, reduced sick leaves or reduced vacancies, can significantly influence the economic success of a nZEB.
The case studies show that it may be hard to find it profitable to build a nearly zero energy building if one only account for improved energy performance or a single co-benefit. The profitability is significantly affected by further values than energy savings, which cannot balance the initial extra-investment for reaching the target nZEB if a short time perspective for evaluating profit is applied. However, the studies show that it may be very profitable to build nZEBs if one accounts for several green values.