
Life Cycle Cost calculation
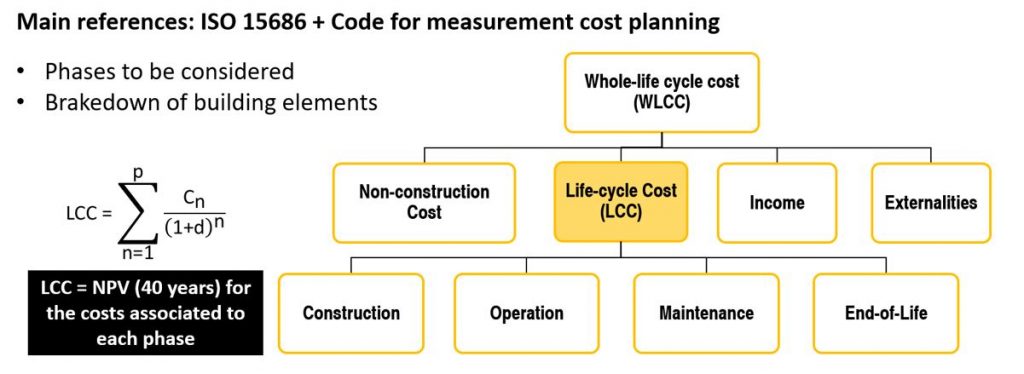
The ISO 15686-5:2008 provides the main principles and features of a LCC calculation, while the European Code of Measurement describes an EU-harmonised structure for the breakdown of the building elements, services, and processes, in order to enable a comprehensive evaluation of the building life costs in this study.
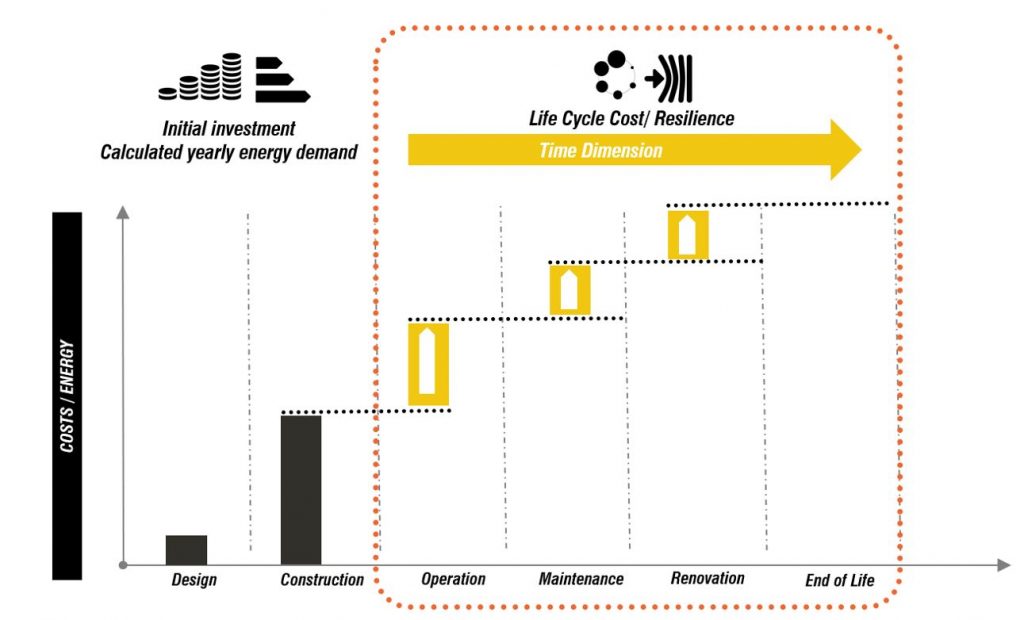
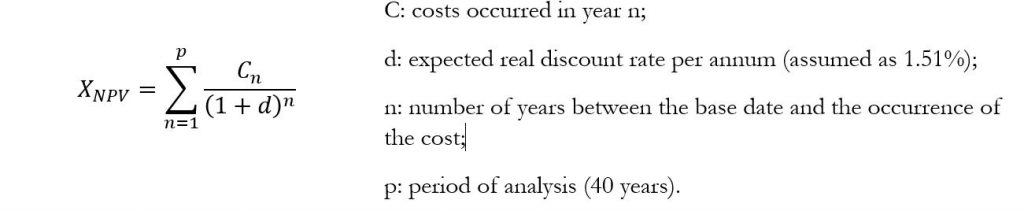
According to the above-mentioned ISO standard, the LCC of a building is the Net Present Value (NPV), that is the sum of the discounted costs, revenue streams, and value during the phases of the selected period of the life cycle.
The NPV is calculated as
follows:
Construction, operation and maintenance phases have been considered, whereas end-of-life stage was discarded as the analyzed period is 40 years, less than an average building lifespan.
LCC calculation was implemented in two steps along CRAVEzero
project. First, for the analysis of the 12 case studies coming from project
partners. Second, for the parametric analysis.
The four main indicators used for the analysis of the calculation results are:
- financing costs
- life cycle costs
- balanced primary energy demand
- balanced CO2 emissions.
The financing costs include costs for planning and actual investment in the form of the construction of the building (life cycle phases 2 and 3 from Table 6). The life cycle costs were described in chapter and include the life cycle phases 2, 3, 4, 5 and 6 (only residual value) from Table 6.
“Balanced” in the case of primary energy and CO2 emissions means that the self-consumption of the PV system was considered, transferred into primary energy and CO2 emissions by the conversion factors for electricity and then subtracted from the calculated primary energy demand and CO2 emissions.
Written as a formula, using
the balanced CO2 emissions as an example:
CO2 emissions
balanced
=
CO2 emissions
- self-consumption of PV
x conversion factor of
electricity
The primary energy demand and the CO2 emissions only consider the energy respectively the emissions from the building operation. Energy and emissions from the building materials, so-called “grey energy” and “grey emissions” are not considered in this report and therefore nor included in these values.[
Assumptions and Boundary Conditions
This section needs to be divided into 2 parts since different approaches were adopted for the LCC calculation during the project, although the construction costs of the analyzed case studies were provided by the project partners in both cases. The buildings have already been constructed, and real cost data was available.
First, for discounting future costs, including annual energy and maintenance costs, over the 40 years lifespan, an average interest rate of 1.51% for the period from 2009 to 2016 (years of construction of the oldest and the most recent case study) was adopted. General inflation was not taken into account since this parameter influences on all case studies in the same way.Second, the costs for the varied technologies and building elements were also directly provided by the project partners. If necessary, assumptions were made according to the CRAVEzero database. All costs are reported as “net costs” (excluding VAT). Land costs and excavation costs were on principle taken into account. The considered buildings are located in Austria, France, Italy, Germany and Sweden. Therefore climate data files were generated with Meteonorm 7.1.8.29631. As mentioned above, the economic evaluation of the variants is based on an observation period of 40 years. This observation period was chosen because this duration is feasible for private housing, as well as for property developers. As a financing scheme, a bank loan was chosen with a credit period time of 25 years and an interest rate of 3 %. The equity interest rate for the equity investment was set to 1.51 %, the inflation rate to 2 % and the discount rate of the used capital investment was 3 %. [All these values were taken from the CRAVEzero LCC-Tool. The different technical maintenance costs and lifespans of the different components are taken into account and based on the gathered data in the report ‘Spreadsheet with LCCs’ and the CRAVEzero database. Cost drivers can also be determined by evaluating individual parameters concerning costs. The following cost items are taken into account: total costs, financing costs, energy costs including basic fees, replacement investments, operation costs, maintenance costs, repairs and residual values. The energy costs also take into account the revenues from the grid feed-in of the electricity generated on the building from renewable sources (e.g. PV electricity). No additional follow-up costs such as administration, insurance, cleaning, security services, building services and demolition costs are included in this report. Rental incomes are not taken into account. All costs are calculated using the “CRAVEzero life-cycle cost tool”, which was developed in the project KoPro LZK+ and CRAVEzero.
Table 2: Boundary condition for economic evaluation
| Economic boundary conditions | Reference |
| Observation period of life-cycle cost | 40 years |
| Equity interest rate | 1.51 % |
| Inflation rate | 2 % |
| Discount rate | 3 % |
| Credit period | 25 years |
| Interest rate bank credit | 3 % |
Operational costs
To provide a homogeneous and comparable
estimation of the energy costs, the evaluation is based on the calculated
energy demand by using the PHPP evaluation tool. In particular, for estimating
both the costs and the revenues (due to the renewables installed), the energy
produced from renewables is considered in the energy balance as a positive
contribution to energy consumption, and the revenues from the renewables have
been discounted from the energy costs.
Energy Prices and Price Increase
The energy costs are calculated for each variant. Based on the
energy demand calculated in PHPP of each variant the resulting cost of each energy
carrier was determined based on final energy consumption. If PV is present in
the specific variant, the electricity demand was reduced by the share of
self-consumption of the PV-electricity. The PV surplus electricity, which
cannot be used directly in the building, was fed back to the grid at
significantly lower rates. The electricity prices were provided by the partners
and are reported in Table 3. The
overall annual energy costs were determined based on final energy consumption
and the associated energy prices. The resulting life cycle cost was taking into
account an energy price increase over the observation period by an annual percentage
(Table 4).
Table 3: Energy prices as boundary conditions of the economic efficiency calculation
| ENERGY CARRIERS | AUSTRIA | FRANCE | ITALY | SWEDEN | UNIT |
| Natural Gas | 0.060 | 0.086 | 0.095 | 0.125 | EUR/kWh |
| Electricity | 0.187 | 0.146 | 0.216 | 0.220 | EUR/kWh |
| District heating | 0.090 | Not relevant | 0.100 | 0.090 | EUR/kWh |
| Wood pellets | 0.050 | Not relevant | 0.070 | 0.050 | EUR/kWh |
| PV feed-in tariff | 0.048 | 0.060 | 0.070 | 0.060 | EUR/kWh |
Table 4: Energy price and feed-in tariffs in the four levels of the parameter „sensitivity“
| LEVEL 1: STANDARD | LEVEL 2: HIGH | LEVEL 3: LOW | LEVEL 4: PHPP DEFAULT | |
| Energy price increase per year | 1.0 % | 2.0 % | 0.5 % | 0 % |
| Increase of PV feed-in tariff per year | 1.7 % | 2.7 % | 0.7 % | 0 % |
Maintenance
costs were determined as a fraction of the initial investment costs per year.
For the parameters, which are not covered in the case study, these factors were
conducted from the CRAVEzero database. The most important building elements are
listed in Table 5. The operation and maintenance costs affect
only the building life cycle after the construction phase. These costs are
particularly relevant for future owners, building operations and property
managers. The analysis is based on standard values from EN 15459:2018 that
provides yearly maintenance costs for each element, including operation,
repair, and service, as a percentage of the initial construction cost.
Table 5: Summary of the most important maintenance costs and maintenance intervals
| POSITION | ACTIVITY | INTERVAL | SHARE OF INVESTMENT COSTS | UNIT |
| Exterior wall | Maintenance | Annually | 1.5 % | EUR/a |
| Floor construction | Maintenance | Annually | 1.5 % | EUR/a |
| Flat roof construction | Maintenance | Annually | 1.5 % | EUR/a |
| Windows and doors | Maintenance | Annually | 1.5 % | EUR/a |
| Ventilation system with heat recovery | Maintenance | Annually | 4.0 % | EUR/a |
| Air distribution system | Cleaning and maintenance | Annually | 6.0 % | EUR/a |
| District heating transfer station | Maintenance | Annually | 3.0 % | EUR/a |
| Ground source heat pump | Maintenance | Annually | 3.0 % | EUR/a |
| Air heat pump | Maintenance | Annually | 3.0 % | EUR/a |
| Thermal collectors | Maintenance | Annually | 1.0 % | EUR/a |
| PV system | Maintenance | Annually | 1.0 % | EUR/a |
The replacement of the construction
components is necessary, especially for active components. The components of
the building envelope have a high technical lifetime and will be not rebuilt,
but demolition costs arise at the end of the life cycle. Note: The end-of-life
analysis was not included in the parametric energy and cost calculations but a
separate chapter was dedicated to this topic (see chapter Fehler!
Verweisquelle konnte nicht gefunden werden.).
[GF6] Active components of the building equipment
are typically renewed several times during the lifetime of the whole building.
In this report, an observation period of 40 years is chosen, which is a
relatively low expected lifetime for the building envelope. This has to be
adjusted if a higher observation period will be chosen. The building elements,
with a lifespan lower than the observation period, are reinvested, and the
remaining residual value is deducted after the observation period.
Table 6 lists the technical lifetime of the building elements, which were gathered from the D2.2 and the CRAVEzero database of WP4, and which were used in the Deliverables D6.1 and D6.2.
Table 6: Technical lifetime of prototypical nZEB elements
| POSITION | TECHN. LIFETIME (YEARS) | POSITION | TECHN. LIFETIME (YEARS) |
| Exterior wall | 40 | Air heat pump | 20 |
| Floor construction | 40 | Buffer storage | 20 |
| Flat roof construction | 40 | Thermal collectors | 20 |
| Windows and doors | 40 | Ventilation unit with heat recovery | 15 |
| External sun protection | 40 | Air ducts, air distribution system | 30 |
| Interior wall and elements | 40 | Compressor cooling | 15 |
| Kitchen and bathroom furniture | 40 | Free cooling | 40 |
| Electric network | 25 | PV - modules | 25 |
| Heat distribution network | 30 | PV - inverter | 15 |
| Floor heating | 40 | Cables for PV and Inverter | 40 |
| District heating transfer station | 20 | Building automation system | 40 |
| Ground source heat pump | 20 |